Table of Contents
Contents are generated from article headings.
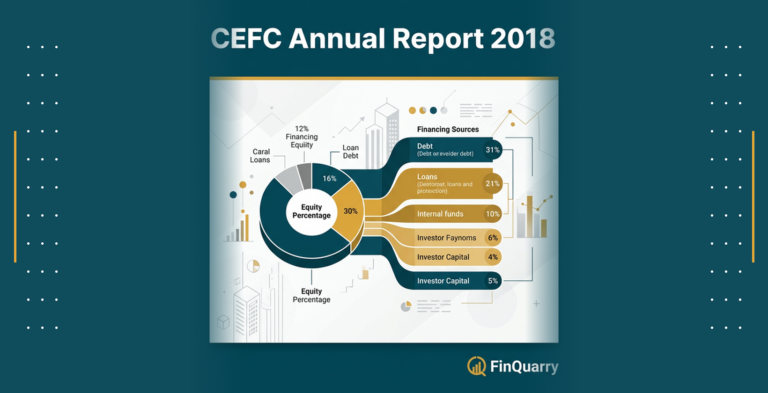
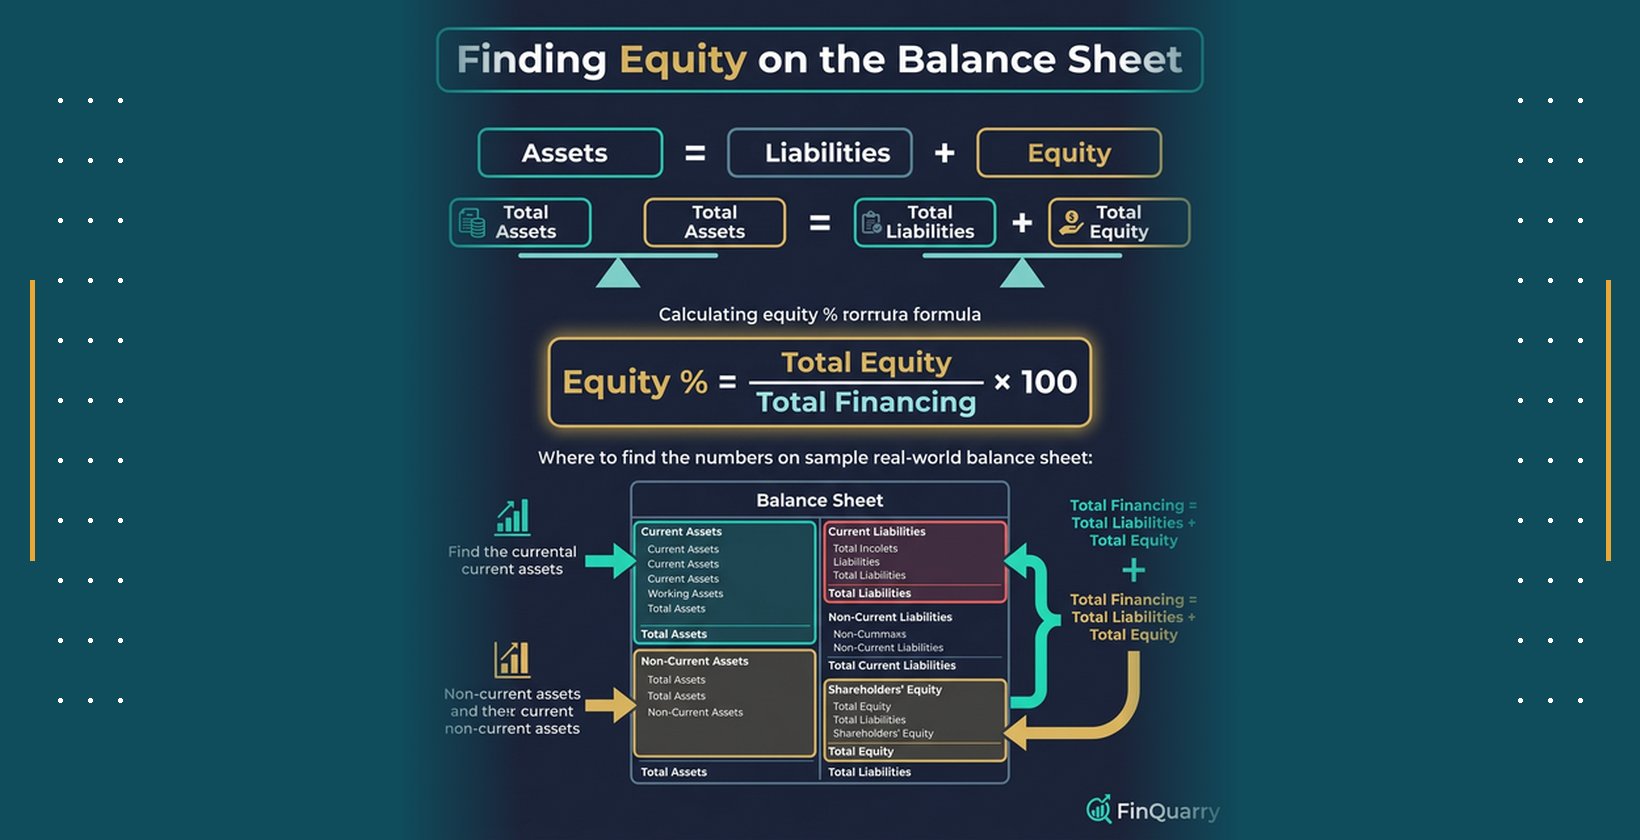
Equity percentage in a 2019 annual report financing structure measures the proportion of total financing provided by equity holders rather than creditors. The formula is: Equity % = Total Equity ÷ (Total Liabilities + Total Equity) × 100. This calculation requires two line items from the audited balance sheet — total equity and the financing base total — and produces a ratio that reflects how much of the entity’s funding derives from equity versus liabilities. Across 2019 annual reports analyzed, equity percentages vary significantly by entity type: BSTDB (development bank) reported 35.4%, Bank of Botetourt (community bank) reported 10.22%, and Deutsche Bank (global bank) reported approximately 4.3%, reflecting fundamentally different business models rather than different financial health levels.
Jurisdiction and Temporal Notice: This content explains financing structure and equity percentage calculation using general financial reporting principles applicable to IFRS and US GAAP annual reports. Specific capital definitions, regulatory ratios, and accounting treatments vary by entity type, reporting standard, and jurisdiction. This analysis uses 2019 annual report data and reporting conventions. Balance sheet presentation formats and equity definitions may differ in subsequent reporting years due to accounting standard updates or regulatory changes.
What “Financing Structure” Means in a 2019 Annual Report
Financing structure in annual report analysis refers to the composition of funding sources on the balance sheet — specifically how total assets are financed through a combination of liabilities and equity. This definition applies directly to the balance sheet equation and forms the foundation for calculating equity percentage correctly.
Financing Structure vs Capital Structure (Don’t Mix These)
Financing structure encompasses all liabilities plus equity as the total funding base, reflecting the complete balance sheet view. Capital structure, by contrast, is a narrower corporate finance term that typically refers only to interest-bearing debt and equity, excluding trade payables, deposits, and other non-debt liabilities. For annual report equity percentage calculations, financing structure is the correct framework because total liabilities and total equity together represent all sources of funding — this distinction prevents the common error of using only debt in the denominator and overstating the equity ratio.
Total Financing = “Total Liabilities and Equity” (Where to Find It)
Total financing in a 2019 annual report appears as the final line on the balance sheet, labeled “Total liabilities and equity,” “Total liabilities and members’ equity,” or “Total liabilities and stockholders’ equity” depending on the entity type. The balance sheet identity — total assets equal total liabilities plus equity — confirms the correct total: if total assets match the combined liabilities and equity figure, the denominator is correct. This line appears at the bottom of the Statement of Financial Position under IFRS and the Balance Sheet under US GAAP, and represents the only correct denominator for financing structure equity percentage.
Equity Can Mean Members’ Equity, Shareholders’ Equity, or Regulatory Capital
Equity in 2019 annual reports carries different labels depending on entity structure. Shareholders’ equity appears in publicly listed corporations and community banks. Members’ equity appears in cooperative institutions, credit unions, and multilateral development banks such as BSTDB. Book equity represents the accounting value of equity as reported under IFRS or GAAP. Regulatory capital — including Common Equity Tier 1 (CET1) and Total Capital ratios — is a separate regulatory construct used by banks that differs from book equity and must not be substituted in financing structure calculations without explicit adjustment.
The Fastest Way to Confirm You’re Using the Right Totals
Consolidated financial statements, rather than parent-only or segment-level statements, provide the correct inputs for equity percentage calculations. Audited consolidated figures carry the external auditor’s confirmation — for BSTDB, Deloitte certification; for Deutsche Bank, KPMG; for Bank of Botetourt, an independent certified public accountant. Segment-level equity figures report only allocated portions of total equity and produce incorrect ratios when used as numerators. The check: total equity plus total liabilities must equal total assets; if this identity holds, the inputs are from the correct statement.
Where to Find the Equity and Total Financing Numbers (Balance Sheet Walkthrough)
Extracting accurate inputs requires locating specific line items from the correct financial statement. Both numbers — total equity and the financing base — appear on a single page of the annual report, making extraction straightforward once the correct statement is identified.
The Exact Balance Sheet Lines That Matter
Two lines are required for equity percentage calculation. First: the total equity line, which appears near the bottom of the equity section — labeled “Total members’ equity” (BSTDB: EUR 830,409 thousand), “Total stockholders’ equity” (Bank of Botetourt: USD 50,268,919), or “Total shareholders’ equity” (Deutsche Bank: EUR 55,857 million). Second: the grand total line — “Total liabilities and equity” — which closes the balance sheet. IFRS-formatted statements present assets first, then liabilities, then equity, with the grand total at the bottom. US GAAP statements follow the same order. Both formats produce the same two inputs needed.
If the Report Is a Bank or Cooperative Institution
Bank and cooperative institution balance sheets carry deposits and borrowings as their dominant liability categories, making liability percentages substantially larger than equity percentages. BSTDB’s 2019 liabilities of EUR 1,513,028 thousand consisted of borrowings, debt securities, and other financial liabilities — not customer deposits, reflecting its development bank funding model. Bank of Botetourt’s liabilities of USD 441,391,466 consisted primarily of interest-bearing and noninterest-bearing deposits, which is the standard community bank funding structure. The liability composition — deposits versus wholesale borrowings — matters for risk interpretation even when equity percentages are similar across institutions.
If the Report Is a Corporate Entity
Corporate balance sheets carry short-term debt, long-term debt, trade payables, and other operating liabilities as the main liability categories. Unlike banks, corporate entities do not hold customer deposits, which generally results in higher equity percentages relative to banking institutions. Retained earnings typically constitute the largest component of corporate equity, alongside paid-in capital and accumulated other comprehensive income (AOCI). When calculating equity percentage for a corporate entity, the equity section includes all these components under the single “total stockholders’ equity” line — the sub-components do not require separate treatment.
What to Do If There Are Multiple Statements (Parent vs Consolidated)
Consolidated financial statements combine the parent entity and all subsidiaries, providing the most complete picture of the financing structure. Parent-only statements exclude subsidiary assets and liabilities, producing different equity percentages that may not reflect the full economic picture. For equity percentage purposes, consolidated statements should be used unless the analysis specifically requires parent-company standalone ratios — in which case, the basis must be explicitly stated. Double counting does not arise from consolidated statements because intercompany eliminations remove intra-group balances before the totals are reported.
How to Calculate Equity Percentage (Step-by-Step)
Equity percentage calculation from a 2019 annual report requires two inputs and one formula. The process is deterministic — the same inputs always produce the same result — but denominator selection and equity definition must be consistent with the financing structure framework.
Equity Percentage Formula (Financing Structure Definition)
Equity % = Total Equity ÷ (Total Liabilities + Total Equity) × 100
The denominator — total liabilities plus total equity — equals total assets by the balance sheet identity, meaning either figure may be used as denominator with identical results. The numerator is the total equity figure from the equity section of the balance sheet. This formula produces the percentage of total financing provided by equity holders. The complement — liabilities percentage — equals 100% minus equity percentage, confirming the two figures sum to the complete financing base.
Worked Example Using 2019 Annual Report Totals
BSTDB 2019:
- Total Members’ Equity: EUR 830,409 thousand
- Total Liabilities: EUR 1,513,028 thousand
- Total Financing: EUR 2,343,437 thousand
- Equity % = 830,409 ÷ 2,343,437 × 100 = 35.4%
- Liabilities % = 1,513,028 ÷ 2,343,437 × 100 = 64.6%
Bank of Botetourt 2019:
- Total Stockholders’ Equity: USD 50,268,919
- Total Liabilities: USD 441,391,466
- Total Financing: USD 491,660,385
- Equity % = 50,268,919 ÷ 491,660,385 × 100 = 10.2%
- Liabilities % = 441,391,466 ÷ 491,660,385 × 100 = 89.8%
Deutsche Bank 2019:
- Total Shareholders’ Equity (Book): EUR 55,857 million
- Total Liabilities: EUR 1,241,817 million
- Total Financing: EUR 1,297,674 million
- Equity % = 55,857 ÷ 1,297,674 × 100 = 4.3%
- Liabilities % = 1,241,817 ÷ 1,297,674 × 100 = 95.7%
None of these three equity percentages appear explicitly in the source annual reports. Each requires derivation from the balance sheet totals using the formula above — making this calculation the primary value gap relative to the source documents.
Liabilities Percentage (The Complement)
Liabilities percentage measures the proportion of total financing sourced from creditors, depositors, and other non-equity providers. Liabilities % = Total Liabilities ÷ (Total Liabilities + Total Equity) × 100. Because equity percentage and liabilities percentage sum to 100%, calculating one automatically produces the other. A liabilities percentage of 64.6% (BSTDB) indicates that approximately two-thirds of the institution’s funding derives from borrowings and other liabilities rather than equity — a relevant leverage indicator when assessing funding stability and loss-absorption capacity.
Optional Ratios: Debt-to-Equity and Equity-to-Assets
Debt-to-equity ratio equals total liabilities divided by total equity, expressing leverage as a multiple rather than a percentage. BSTDB’s 2019 D/E ratio: 1,513,028 ÷ 830,409 = 1.82, meaning liabilities were 1.82 times equity. Equity-to-assets ratio equals total equity divided by total assets — and since total assets equal total liabilities plus equity, this produces the same result as the financing structure equity percentage. Both formulations are mathematically equivalent when total assets equal total financing, which holds for all standard consolidated balance sheets. Debt-to-equity is useful for leverage comparisons; equity percentage is cleaner for financing mix visualization.
How to Interpret Equity Percentage (What It Says About Risk and Leverage)
Equity percentage interpretation requires context — specifically, the entity type, industry norms, and liability composition. A 4.3% equity percentage does not signal distress at Deutsche Bank; it reflects the structural reality of large-bank balance sheets where deposit and wholesale funding dominate. Interpretation without industry benchmarking generally leads to incorrect conclusions.

What a Higher Equity % Usually Signals
A higher equity percentage generally indicates a larger loss-absorbing buffer, because equity holders absorb losses before creditors in most jurisdictions. BSTDB’s 35.4% equity percentage reflects its development bank mandate, where callable capital from member states and paid-in contributions create a conservative capitalization well above commercial bank norms. Higher equity percentages tend to reduce funding sensitivity to market conditions because less refinancing risk exists — a greater share of funding is permanent equity rather than maturing liabilities requiring rollover. This pattern aligns with widely accepted capital adequacy principles in institutional finance.
What a Lower Equity % Usually Signals
A lower equity percentage generally indicates higher leverage, meaning a larger portion of assets is funded by liabilities that must be repaid or renewed. Deutsche Bank’s 4.3% equity percentage reflects the typical structure of a globally significant bank where customer deposits, interbank borrowings, and issued securities constitute the dominant funding sources. Lower equity percentages increase sensitivity to asset quality deterioration because a smaller equity buffer exists before liabilities become impaired. However, lower equity percentages do not necessarily indicate weaker institutions — regulatory capital requirements and asset quality may provide adequate protection even at low accounting equity ratios.
The Role of Deposits, Borrowings, and Liability Mix
Two institutions with identical equity percentages may carry materially different risk profiles depending on liability composition. A bank funding 89% of assets through stable retail deposits (Bank of Botetourt) generally faces lower liquidity risk than a bank funding a similar percentage through short-term wholesale borrowings, because deposits tend to demonstrate lower volatility during stress periods than market-sourced funding. Liability maturity structure, depositor concentration, and the proportion of secured versus unsecured borrowings all affect funding stability independently of the equity percentage figure. Equity percentage measures one dimension of the financing structure; full assessment requires examining the liability side as well.
Why Equity % Alone Does Not Eliminate Risk
Equity percentage measures financing composition, not asset quality, profitability, or liquidity. An institution with a 40% equity percentage could carry significant risk if asset quality has deteriorated or liquidity buffers are inadequate. Equity percentage does not capture off-balance-sheet exposures, contingent liabilities, or concentration risks that may affect solvency under stress conditions. For regulated financial institutions, regulatory capital ratios — CET1, leverage ratio — provide additional risk perspectives that complement but do not replace the financing structure equity percentage.
The “Bank-Style” Twist: Book Equity vs Regulatory Capital
Bank annual reports present multiple equity-related metrics that can create confusion when calculating financing structure equity percentage. Book equity, tangible equity, and regulatory capital ratios each measure different aspects of capitalization and are not interchangeable.
Book Equity vs Tangible Equity
Book equity is the accounting total reported on the balance sheet under IFRS or GAAP — the figure used in equity percentage calculations. Tangible equity adjusts book equity by removing goodwill and other intangible assets, on the basis that these assets may not retain value under stress. Deutsche Bank’s 2019 tangible shareholders’ equity differed from its book equity of EUR 55,857 million due to goodwill and intangible asset deductions. Using tangible equity as the numerator produces a lower equity percentage than using book equity — both calculations are valid but must be clearly labeled to avoid misinterpretation.
Why CET1 or Leverage Ratios Are Not the Same as Equity %
CET1 ratio — Common Equity Tier 1 capital as a percentage of risk-weighted assets — measures regulatory capital adequacy against a risk-adjusted asset base, not the full financing structure. A bank’s CET1 ratio of 13% does not mean equity represents 13% of total financing; it means CET1-eligible capital represents 13% of risk-weighted assets, which are a subset of total assets adjusted by risk factors. Risk-weighted assets may be substantially lower than total assets depending on asset composition. Substituting CET1 or leverage ratios for financing structure equity percentage produces fundamentally different numbers measuring fundamentally different concepts — a critical disambiguation for anyone analyzing bank annual reports.
How Annual Reports Reconcile These Views
Annual reports typically present a capital management section in the notes to financial statements that reconciles book equity to regulatory capital measures. This section discloses deductions for goodwill, intangible assets, deferred tax assets, and other regulatory adjustments applied to arrive at CET1 capital. The BSTDB 2019 annual report references Basel II capital guidelines and maintains a gearing ratio under Article 15 — a statutory limit restricting operations to 150% of unimpaired subscribed capital. These institutional-specific capital constraints exist alongside but separately from the financing structure equity percentage derived from the balance sheet.
The Safe Way to Quote Equity Percentage in Analysis
Equity percentage should always be quoted with three clarifications: the equity basis used (book equity, members’ equity, or adjusted equity), the reporting standard (IFRS or GAAP), and the consolidated status (consolidated or parent-only). Example: “BSTDB’s equity percentage as at 31 December 2019 was 35.4%, calculated as total members’ equity (EUR 830,409 thousand) divided by total liabilities and members’ equity (EUR 2,343,437 thousand) from the IFRS-compliant consolidated Statement of Financial Position audited by Deloitte.” This precision prevents misinterpretation and allows independent verification from the source document.
Common Mistakes That Produce the Wrong Equity Percentage
Several systematic errors produce incorrect equity percentages when working with annual report balance sheets. Each error involves either denominator misselection or equity definition substitution.
Using Total Assets Incorrectly
Total assets equal total liabilities plus equity under the balance sheet identity, meaning equity-to-assets and equity-to-financing produce mathematically identical results for standard consolidated balance sheets. The error arises when analysts use partial asset figures — segment assets, average assets, or adjusted assets — rather than the consolidated total that matches the financing base. If total assets used as denominator do not equal total liabilities plus total equity, the denominator is incorrect and must be replaced with the full balance sheet total.
Mixing Segment Equity or Average Equity
Segment-level equity figures report allocated portions of total equity assigned to business divisions and do not sum to total equity without aggregation across all segments plus unallocated amounts. Deutsche Bank’s segment reporting allocates shareholders’ equity across Corporate Bank, Investment Bank, Private Bank, and Asset Management — using any single segment’s allocated equity as numerator produces a ratio that is not comparable to the balance sheet equity percentage. Average equity — calculated over multiple periods — serves return-on-equity calculations but is not appropriate for point-in-time financing structure analysis.
Confusing Regulatory Equity with Book Equity
CET1 capital ratios and leverage exposure ratios use regulatory definitions that apply deductions, filters, and adjustments to book equity before calculating the ratio. Applying a bank’s reported CET1 ratio percentage to total assets to back-calculate an equity amount will not reproduce the book equity on the balance sheet. For financing structure purposes, book equity from the audited balance sheet is the correct input — regulatory capital measures should be analyzed separately in dedicated capital adequacy discussion and clearly distinguished from the balance sheet equity percentage.
Decision Guidance: How to Use Equity % Properly
Equity percentage functions as a useful comparative metric when applied within consistent frameworks. Cross-entity comparisons without controlling for entity type, reporting standard, and business model tend to produce misleading conclusions.
Compare Within Same Industry and Reporting Framework
Equity percentages are most informative when compared across entities with similar business models and identical accounting frameworks. Comparing BSTDB’s 35.4% to Deutsche Bank’s 4.3% reflects a development bank versus a global commercial bank — structurally incomparable. Within community banking, Bank of Botetourt’s 10.2% can be benchmarked against peer community banks under US GAAP. IFRS and GAAP produce different book values for the same economic positions due to measurement differences in financial instruments, lease accounting, and provisions — cross-standard comparisons require disclosure of this limitation.
Pair Equity % with One Supporting Metric
Equity percentage combined with one supporting metric provides more robust financing structure assessment than equity percentage alone. Useful pairings include: debt maturity profile (short-term versus long-term liabilities as share of total liabilities), deposit stability (proportion of funding from core retail deposits versus wholesale markets), or asset quality indicator (non-performing loan ratio for banks). BSTDB’s 35.4% equity percentage gains additional meaning when paired with its Article 15 gearing constraint — actual leverage of 1.82x compares to the 1.5x institutional limit, indicating the institution operates within but at a level exceeding its statutory target at the 2019 year-end position.
Final Validation Checklist Before Publishing or Citing
Before citing equity percentage from a 2019 annual report, verify five items: (1) the equity figure is from the consolidated balance sheet, not a segment or parent-only statement; (2) the denominator is “total liabilities and equity” matching the balance sheet grand total; (3) total assets equal total liabilities plus equity — confirming the identity holds; (4) the equity definition is book equity, not regulatory capital or tangible equity, unless explicitly stated otherwise; (5) the reporting standard (IFRS or GAAP) and audit status are noted. These five checks prevent the most common calculation and citation errors in annual report equity percentage analysis.
Frequently Asked Questions
What is equity percentage in financing structure? Equity percentage in financing structure measures the proportion of total funding — liabilities plus equity — contributed by equity holders. It is calculated by dividing total equity by total liabilities and equity, then multiplying by 100. The result expresses how much of an entity’s financing base consists of equity rather than borrowed or owed funds.
How do you calculate equity percentage from a balance sheet? Equity percentage requires two balance sheet inputs: total equity (from the equity section) and total liabilities and equity (the balance sheet grand total). The formula is: Equity % = Total Equity ÷ Total Liabilities and Equity × 100. Both inputs appear on the Statement of Financial Position under IFRS or the Balance Sheet under US GAAP.
Is equity percentage the same as capital ratio? Equity percentage and regulatory capital ratio are not the same. Equity percentage divides book equity by total financing. Regulatory capital ratios — such as CET1 — divide regulatory capital (adjusted book equity) by risk-weighted assets. These produce different numbers because both the numerator and denominator differ. For bank annual reports, distinguishing between these two metrics is essential for accurate interpretation.
What is a good equity percentage? Equity percentage norms vary substantially by entity type. Development banks typically maintain 25–45% equity percentages due to conservative capitalization mandates. Community banks commonly range from 8–12%. Global systemically important banks often report 4–8%. Corporate entities outside financial services generally carry 30–70%, depending on industry leverage norms. No universal benchmark applies; equity percentage assessment requires industry-specific context.
Does equity percentage include retained earnings? Equity percentage uses total equity as the numerator, which typically includes paid-in capital, retained earnings, reserves, and accumulated other comprehensive income (AOCI). Retained earnings are a component of total equity — they are included automatically when using the total equity line from the balance sheet rather than requiring separate addition.
Is equity percentage the same as equity-to-assets? For standard consolidated balance sheets, equity percentage (equity ÷ total liabilities and equity) produces the same numerical result as equity-to-assets (equity ÷ total assets), because total assets equal total liabilities plus equity by the balance sheet identity. The two formulations differ only when total assets used in the calculation exclude certain items, making them unequal to the financing base. Under normal consolidated reporting, both formulas are equivalent.